


In today’s data-driven landscape, the ability to effectively manage and analyze datasets is pivotal for uncovering meaningful insights. Among the myriad of tools available, the ELK Stack—encompassing Elasticsearch, Logstash, and Kibana—stands out as a potent trio designed for real-time data processing, analysis, and visualization. This article delves into how you can harness the power of the ELK Stack to transform raw data into actionable intelligence, seamlessly.
Introduction to the Power Trio: ELK Stack
The ELK Stack is a cohesive suite of open-source tools that synergistically provide a comprehensive solution for data analysis challenges. Elasticsearch acts as the heart, a search and analytics engine storing and indexing your data. Logstash serves as the veins, a server-side data processing pipeline that ingests data from various sources, transforms it, and then sends it to Elasticsearch. Kibana, the brain, offers a data visualization dashboard for Elasticsearch, enabling you to visualize and query your data with ease. Together, these tools forge a robust framework for data exploration, visualization, and real-time analysis.
Step 1: Setting the Stage with Your ELK Stack
Kickstarting Elasticsearch: Your first move is to install Elasticsearch, which will diligently store and index your data. After ensuring your system meets the prerequisites, like having Java installed, download and run Elasticsearch. Confirm its successful launch by accessing it through your web browser on port 9200.
Initializing Logstash: Next, set up Logstash to process the data before Elasticsearch indexes it. Crafting a Logstash configuration file is key, as it dictates how to ingest data into Elasticsearch. Your configuration will vary based on the data sources and types you’re working with.
Activating Kibana: Finally, install Kibana to start visualizing and querying your data. Post-installation, connect Kibana to your Elasticsearch instance and use the web interface to begin crafting visualizations.
Step 2: Feeding Your Data
With the ELK Stack ready, your next venture is to ingest your dataset into Elasticsearch via Logstash. This step is crucial, as it involves defining a Logstash configuration file that outlines the input source, any data processing filters, and Elasticsearch as the output destination.
- Input: Clearly specify where your data comes from. Logstash’s versatility shines here, with support for various data inputs.
- Filter: This stage is about transforming or enriching your data. Utilize filters like grok for parsing unstructured data into a structured format, mutate for altering data fields, and drop for filtering out specific events.
- Output: Ensure Elasticsearch is the designated output, including the index where your data will reside.
Step 3: Unleashing Analysis and Visualization with Kibana
Upon ingesting your data into Elasticsearch, Kibana becomes your playground for analysis and visualization:
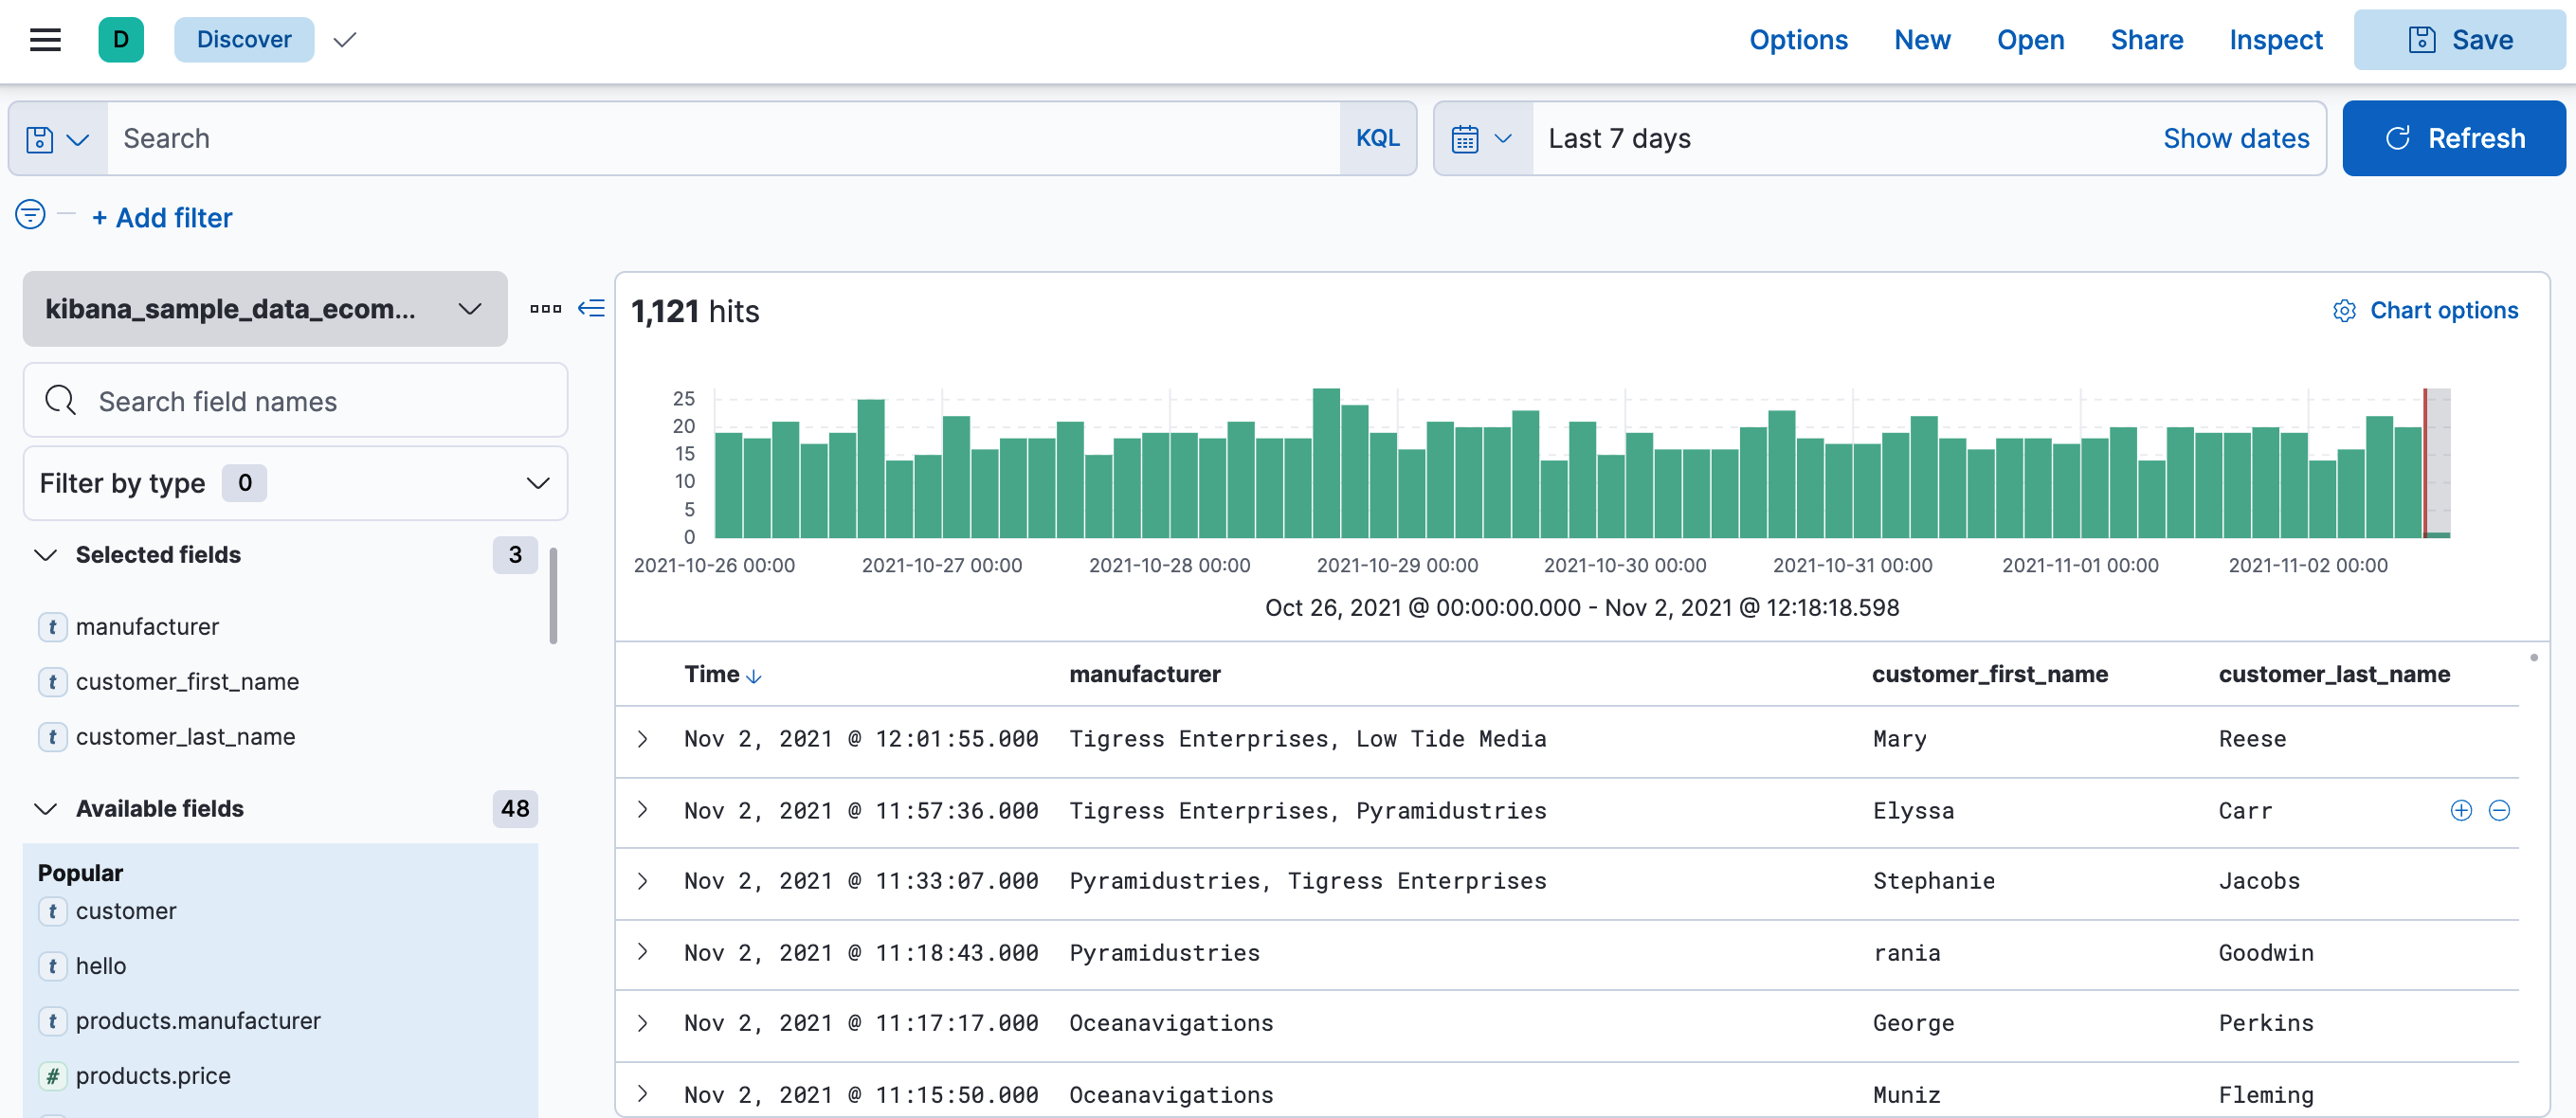
- Explore with Discover: Kibana’s Discover feature lets you dive deep into your data. Here, you can effortlessly search, filter, and examine the fields and documents in your index.
- Create Visualizations: Kibana excels in offering a diverse array of visualization options. Choose from simple charts to complex maps to best represent your dataset.
- Design Dashboards: Dashboards are where you bring together various visualizations for a holistic view of your data. These customizable and shareable dashboards are ideal for comprehensive reporting and analysis.
Embracing Best Practices for ELK Data Analysis
- Strategize Your Data Schema: A deep understanding of your data and your query needs will guide you in structuring your data efficiently in Elasticsearch.
- Keep Performance in Check: As your data volume grows, monitoring the performance of your ELK Stack is crucial. Elasticsearch has several scaling and management features to help you maintain optimal performance.
- Prioritize Security: Don’t overlook securing your stack. Implement necessary measures like user authentication and data encryption to safeguard your data.
